The Map That Made Cholera Visible
John Snow’s famous map mattered because it joined evidence to a decision.
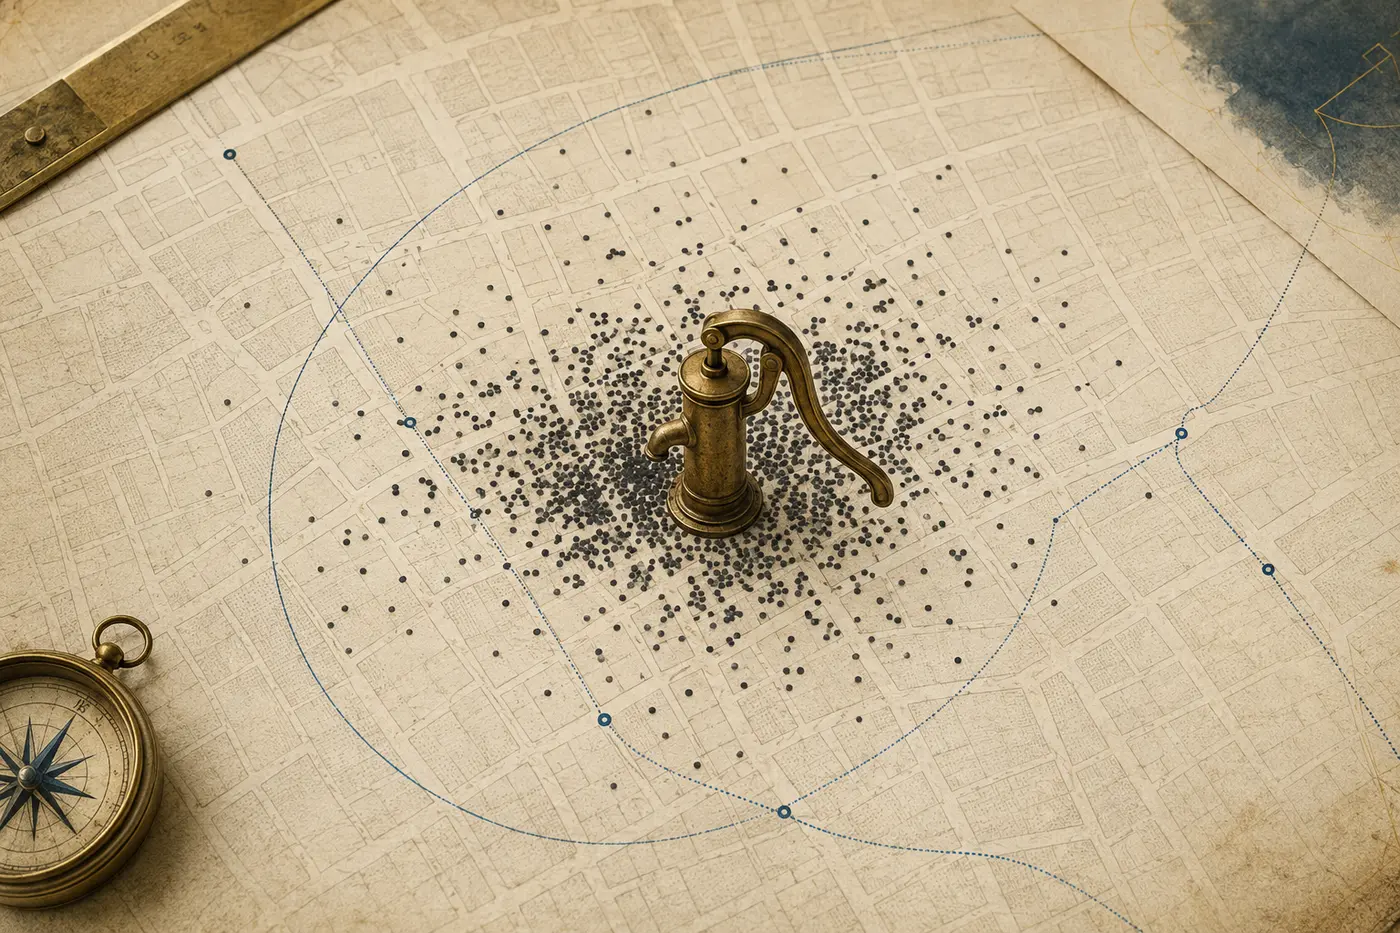
Conceptual editorial image. It illustrates the subject and is not documentary evidence.
During the 1854 Soho outbreak, physician John Snow mapped deaths around the Broad Street pump.
A contested explanation in Soho
When cholera struck Soho in 1854, the dominant explanations of disease did not yet rest on modern germ theory. John Snow had argued that cholera spread through contaminated water. During the outbreak he gathered addresses of deaths and examined their relationship to water sources, including the pump on Broad Street.
The famous dot map was not a magical discovery device used in isolation. Snow combined mapping with interviews, comparison and prior reasoning. Local clergyman Henry Whitehead contributed important knowledge of the community and helped investigate cases. The pump handle was removed, but the outbreak was already declining, making simple claims about what single action ‘ended’ it misleading.
Mid-nineteenth-century London combined rapid population growth with inadequate water and waste infrastructure. Wells, cesspools and crowded housing existed in close proximity. Cholera arrived in waves, killing quickly through severe dehydration, while many physicians and officials still interpreted disease through miasma—the idea that poisonous air or foul smells transmitted illness.
Miasma was not foolishness invented for a modern audience to defeat. Smell often did accompany filthy and dangerous conditions, and sanitation reforms associated with miasmatic thinking could improve health. The error lay in treating air as the vehicle of cholera when contaminated water better explained the pattern of cases.
Snow had an argument before the outbreak
John Snow had already argued that cholera was communicated through something swallowed, and he investigated earlier epidemics. His work compared populations receiving water from different suppliers, an approach that sought variation capable of testing competing explanations rather than merely describing suffering (Snow, 1855).
The 1854 Broad Street outbreak gave him a concentrated local case. Snow gathered information on deaths and water use, spoke with residents and examined exceptions. The famous map was one part of this investigation, not a solitary flash of graphical genius.
Snow plotted deaths as marks along streets surrounding the Broad Street pump. The visual concentration made geographical proximity difficult to ignore. It turned a list of addresses into a spatial argument and helped readers see that the distribution followed access to water more persuasively than a vague cloud of bad air.
But the map did not contain a laboratory identification of Vibrio cholerae, and proximity alone could not prove the mechanism. Snow strengthened the case through details: households that used other water, workers at a nearby brewery, and people who travelled to obtain Broad Street water. Exceptions became tests rather than embarrassments.
The pump handle story needs restraint
Local authorities removed the pump handle after Snow presented his findings. Retellings often imply that this single act stopped the epidemic. In fact, cases were already declining, and the decision’s immediate effect is difficult to isolate. The action still mattered as a precaution and as a public acknowledgement that the water source was suspect.
This correction does not diminish Snow. It makes the episode more useful. Evidence can support a prudent intervention even before every causal detail is settled, while the intervention’s symbolic importance may exceed its measurable effect on an outbreak already changing.
Snow’s investigation required addresses, household testimony and knowledge of water habits that no central database could supply. He and collaborators reconstructed behaviour after deaths had occurred. That labour matters because maps can make data appear as if it arrived already clean and spatially precise.
Field investigation also allowed anomalies to become informative. A distant death could be linked to a person who preferred Broad Street water; an apparently protected workplace might have its own supply. The map guided questions, and answers refined the meaning of the map.
Local knowledge corrected the formal record
Official death records supplied structure, but residents knew who used which pump, who had left the area and which workplaces provided alternative drinks. That knowledge was uneven and sometimes retrospective, yet it allowed investigators to interpret the map as a pattern of exposure rather than a pattern of residence alone.
Modern analysts can make the opposite mistake: trusting centralized data because it is standardized and treating local testimony as anecdote. Strong investigation tests them against each other. Administrative data reveals scale; lived knowledge identifies mechanisms and missing cases that the form was not designed to capture.
The episode became a durable example of spatial reasoning in public health, though the popular retelling often simplifies the evidence and debate.
The map became larger than the episode
Snow’s work endured because it demonstrated a way of joining place, exposure and outcome. Later public-health practice made spatial epidemiology far more systematic. The episode also became a teaching story about data visualisation—sometimes at the cost of flattening the uncertainty, collaboration and prior argument that made the map meaningful.
A map can reveal a cluster, but it cannot by itself establish why the cluster exists. Choices about boundaries, denominators and missing observations shape the argument. The stronger legacy is therefore not ‘make a map’; it is ‘make the chain of reasoning inspectable’.
The map endures because it joins place, population and exposure. Modern epidemiology uses far more sophisticated statistical and geographic tools, yet the underlying habit remains recognizable: locate cases, compare exposures, test alternatives and ask whether the observed pattern could arise for another reason.
Its fame can become misleading when design is detached from investigation. Attractive marks on a map do not become evidence simply by clustering. Data quality, denominator populations, missing cases, mobility and the choice of geographic scale all influence the pattern a viewer sees.
Institutions needed a usable reason to act
Public-health evidence matters when it changes decisions about water, sanitation, warnings or treatment. Snow’s work entered an institutional debate involving local officials, engineers, physicians and residents. The map translated a technical claim into a form that could support administrative action.
That translation remains essential. Experts may possess strong analysis while decision-makers face legal, financial and political constraints. A successful evidence product must make the causal claim, uncertainty and available action legible without pretending that the choice is purely scientific.
Snow deserves recognition, but London’s later reduction of waterborne disease depended on sewer construction, water treatment, regulation, laboratory science and sustained public investment. A single investigator can reveal a mechanism; only institutions can rebuild the conditions that repeatedly produce exposure.
The distinction matters in modern crisis storytelling. Celebrating a brilliant analyst is easier than funding maintenance, inspection and pipes. Yet durable health gains usually come from boring systems that continue working after the famous map leaves the wall.
Categories and maps can stigmatize
Mapping disease may direct resources, but it can also label neighbourhoods or groups as dangerous. A hotspot may reflect exposure, testing access, reporting practice or structural disadvantage. When viewers confuse location with blame, visualization can reinforce stigma rather than clarify cause.
Responsible mapping therefore asks what the unit represents and what it omits. Showing cases without water access, population density or uncertainty may produce an emotionally clear but analytically false picture. Evidence design carries ethical consequences because maps redistribute attention and suspicion.
Miasma theory was wrong about cholera transmission, yet campaigns motivated by foul air often demanded cleaner streets and sewers. Public health advanced through a mixture of correct and incorrect explanations, political pressure and engineering. Later germ theory provided stronger causal grounding.
This untidy history warns against assuming that effective action always waits for a complete theory. It also warns against preserving a weak theory merely because some associated reforms worked. Policy and explanation should be evaluated separately, then brought into better alignment as evidence improves.
The denominator is the invisible half of a map
Case dots show where deaths occurred, but risk requires knowing how many people were exposed. A crowded block may contain more cases because it contains more residents. Snow’s local analysis gained force from knowledge of pump use and nearby populations, not from visual density alone.
Modern maps that omit denominators can mislead viewers into treating population centres as unusually dangerous. Rates, uncertainty and exposure patterns are harder to display than raw counts, but they are essential when the purpose is comparison.
Popular memory seeks the one decisive graphic. In practice, the waterborne account accumulated strength from multiple outbreaks, supplier comparisons, pathology, microbiology and the eventual performance of sanitation systems. The map belongs inside that convergence.
This is how reliable knowledge usually matures. No single study bears the entire conclusion. Independent methods fail in different ways; when they point toward the same mechanism, confidence increases.
A map persuades through selective clarity
Every visualization removes information. Snow’s map emphasized streets, deaths and the pump while omitting many other features. That selection was legitimate because it matched the causal question. A map becomes manipulative when its selection is hidden or chosen to produce an impression unrelated to the stated question.
Design ethics therefore begins before colour and typography. It asks why this variable, this boundary and this comparison were chosen. A transparent caption can state what the marks represent, what they do not and where the data came from. Such restraint increases trust because it makes the argument inspectable.
Good visualization is not decoration. It is an argument whose assumptions must remain visible.
Seeing patterns without worshipping them
Today, dashboards can render vast datasets instantly. Speed does not remove the need to ask who is counted, what comparison is appropriate and whether the display supports a causal claim. Beautiful graphics can make a weak inference feel settled.
Snow’s case remains useful precisely when told without mythology. Evidence gained force through a combination of observation, theory, local knowledge and a decision that could be tested. Visualisation was part of the argument, not a substitute for it.
Digital surveillance can now update disease maps rapidly, integrate mobility and laboratory data, and reveal patterns across scales. Speed supports earlier action, but it also magnifies errors. An unstable estimate can circulate globally before analysts have explained its limits.
The Snow lesson is not simply to map more. It is to connect visualization to a causal question. A dashboard should help users decide what evidence would distinguish competing explanations, not merely invite them to watch numbers move.
Privacy is part of public health
Fine-grained data can help locate exposure while increasing the risk that individuals or small communities are identified. The technical capacity to plot an address does not create an ethical entitlement to publish it. Aggregation, access controls and clear purpose remain part of sound analysis.
Trust affects whether people seek tests, report contacts or cooperate with authorities. A system that extracts maximum data while losing public confidence may reduce its own long-term effectiveness. The map and the institution around it must be judged together.
When a visualization appears to settle an argument, ask where the data came from, who is missing, which denominator was used, how geography was selected and whether the picture tests causation or only shows correlation. Then ask what decision the graphic is trying to support.
Snow’s map remains powerful not because dots are inherently truthful, but because they were embedded in observation, comparison and a falsifiable account of transmission. The enduring standard is not visual elegance. It is whether the picture makes better reasoning possible.
Maps should reveal uncertainty
Interactive systems can show confidence ranges, missing data and alternative boundaries rather than presenting one polished surface. This may reduce visual drama, but it improves the viewer’s ability to judge whether a pattern is robust.
The design challenge is to make uncertainty usable without making every conclusion look equally doubtful. Strong evidence should remain clear. The purpose of uncertainty is calibration, not paralysis.
A public-health map is most useful when it connects a pattern to a responsible action, owner and review point. Otherwise, viewers may receive anxiety without agency. The Broad Street episode endures partly because a contested explanation met an available intervention.
Modern dashboards should state what threshold changes guidance, what decision has already been made and when the evidence will be reassessed. A map that cannot enter a decision process risks becoming decoration for institutional awareness.
The modern equivalent is a linked evidence record
A useful public-health page should connect the map to method, data definitions, revisions and the decision it informed. Separating these across inaccessible reports weakens accountability and makes later correction difficult.
The lasting innovation is therefore not one image but a chain: observation, representation, challenge, action and review. Digital tools can preserve that chain more completely than paper if institutions design for provenance instead of display alone.
A cluster makes a question visible; it does not answer the question by itself. Snow’s achievement was to combine spatial pattern with a plausible transmission mechanism, field evidence and cases that could test the explanation. The map is persuasive because the investigation survives beyond the image.
Modern tools can produce maps before analysts understand what the data represents. This reverses the proper order. Visualization should emerge from a defined question and remain connected to methods, denominators and uncertainty. Otherwise, the clarity of the picture exceeds the clarity of the evidence.
The Broad Street story endures because it joins knowledge to responsibility. An institution faced a contested explanation and an available precaution. That pattern remains central to public health: act proportionately under uncertainty, document why, and continue testing after the immediate decision. Evidence is not a poster on the wall. It is a process that can be challenged and improved.
A visualisation changes history only when evidence, argument and institutional action meet.
References
Sources are listed in Harvard author–date format. Links are provided where a stable public record is available.
- Johnson, S. (2006) The Ghost Map. New York: Riverhead Books.
- Snow, J. (1855) On the Mode of Communication of Cholera. 2nd edn. London: John Churchill. Available at: https://archive.org/details/b28985266 (Accessed: 22 July 2026).
- Vinten-Johansen, P. et al. (2003) Cholera, Chloroform, and the Science of Medicine. Oxford: Oxford University Press.